


Interactive maps, charts, and stats tracking turnout and registration in the 2022 elections, including analysis of how voters turned out after redistricting rulings which led to two primaries.
 The Voter Analysis Report for 2022-2023 is a comprehensive analysis of the 2022 elections including an analysis of split primaries, ballot proposals, redistricting, and policy recommendations to expand access to voting and improve future NYC elections. The tabs on this page include an executive summary and interactive maps, providing additional context for the full PDF version of the report. Read the Voter Analysis Report.
With a complex redistricting process, a split primary, a series of special elections, and four ballot proposals, 2022 was an unconventional year for New York City elections. This year’s Voter Analysis Report examines the different ways these factors impacted voters. We also offer recommendations that could increase turnout and make election information more accessible to the public
2022 Elections Turnout Summary
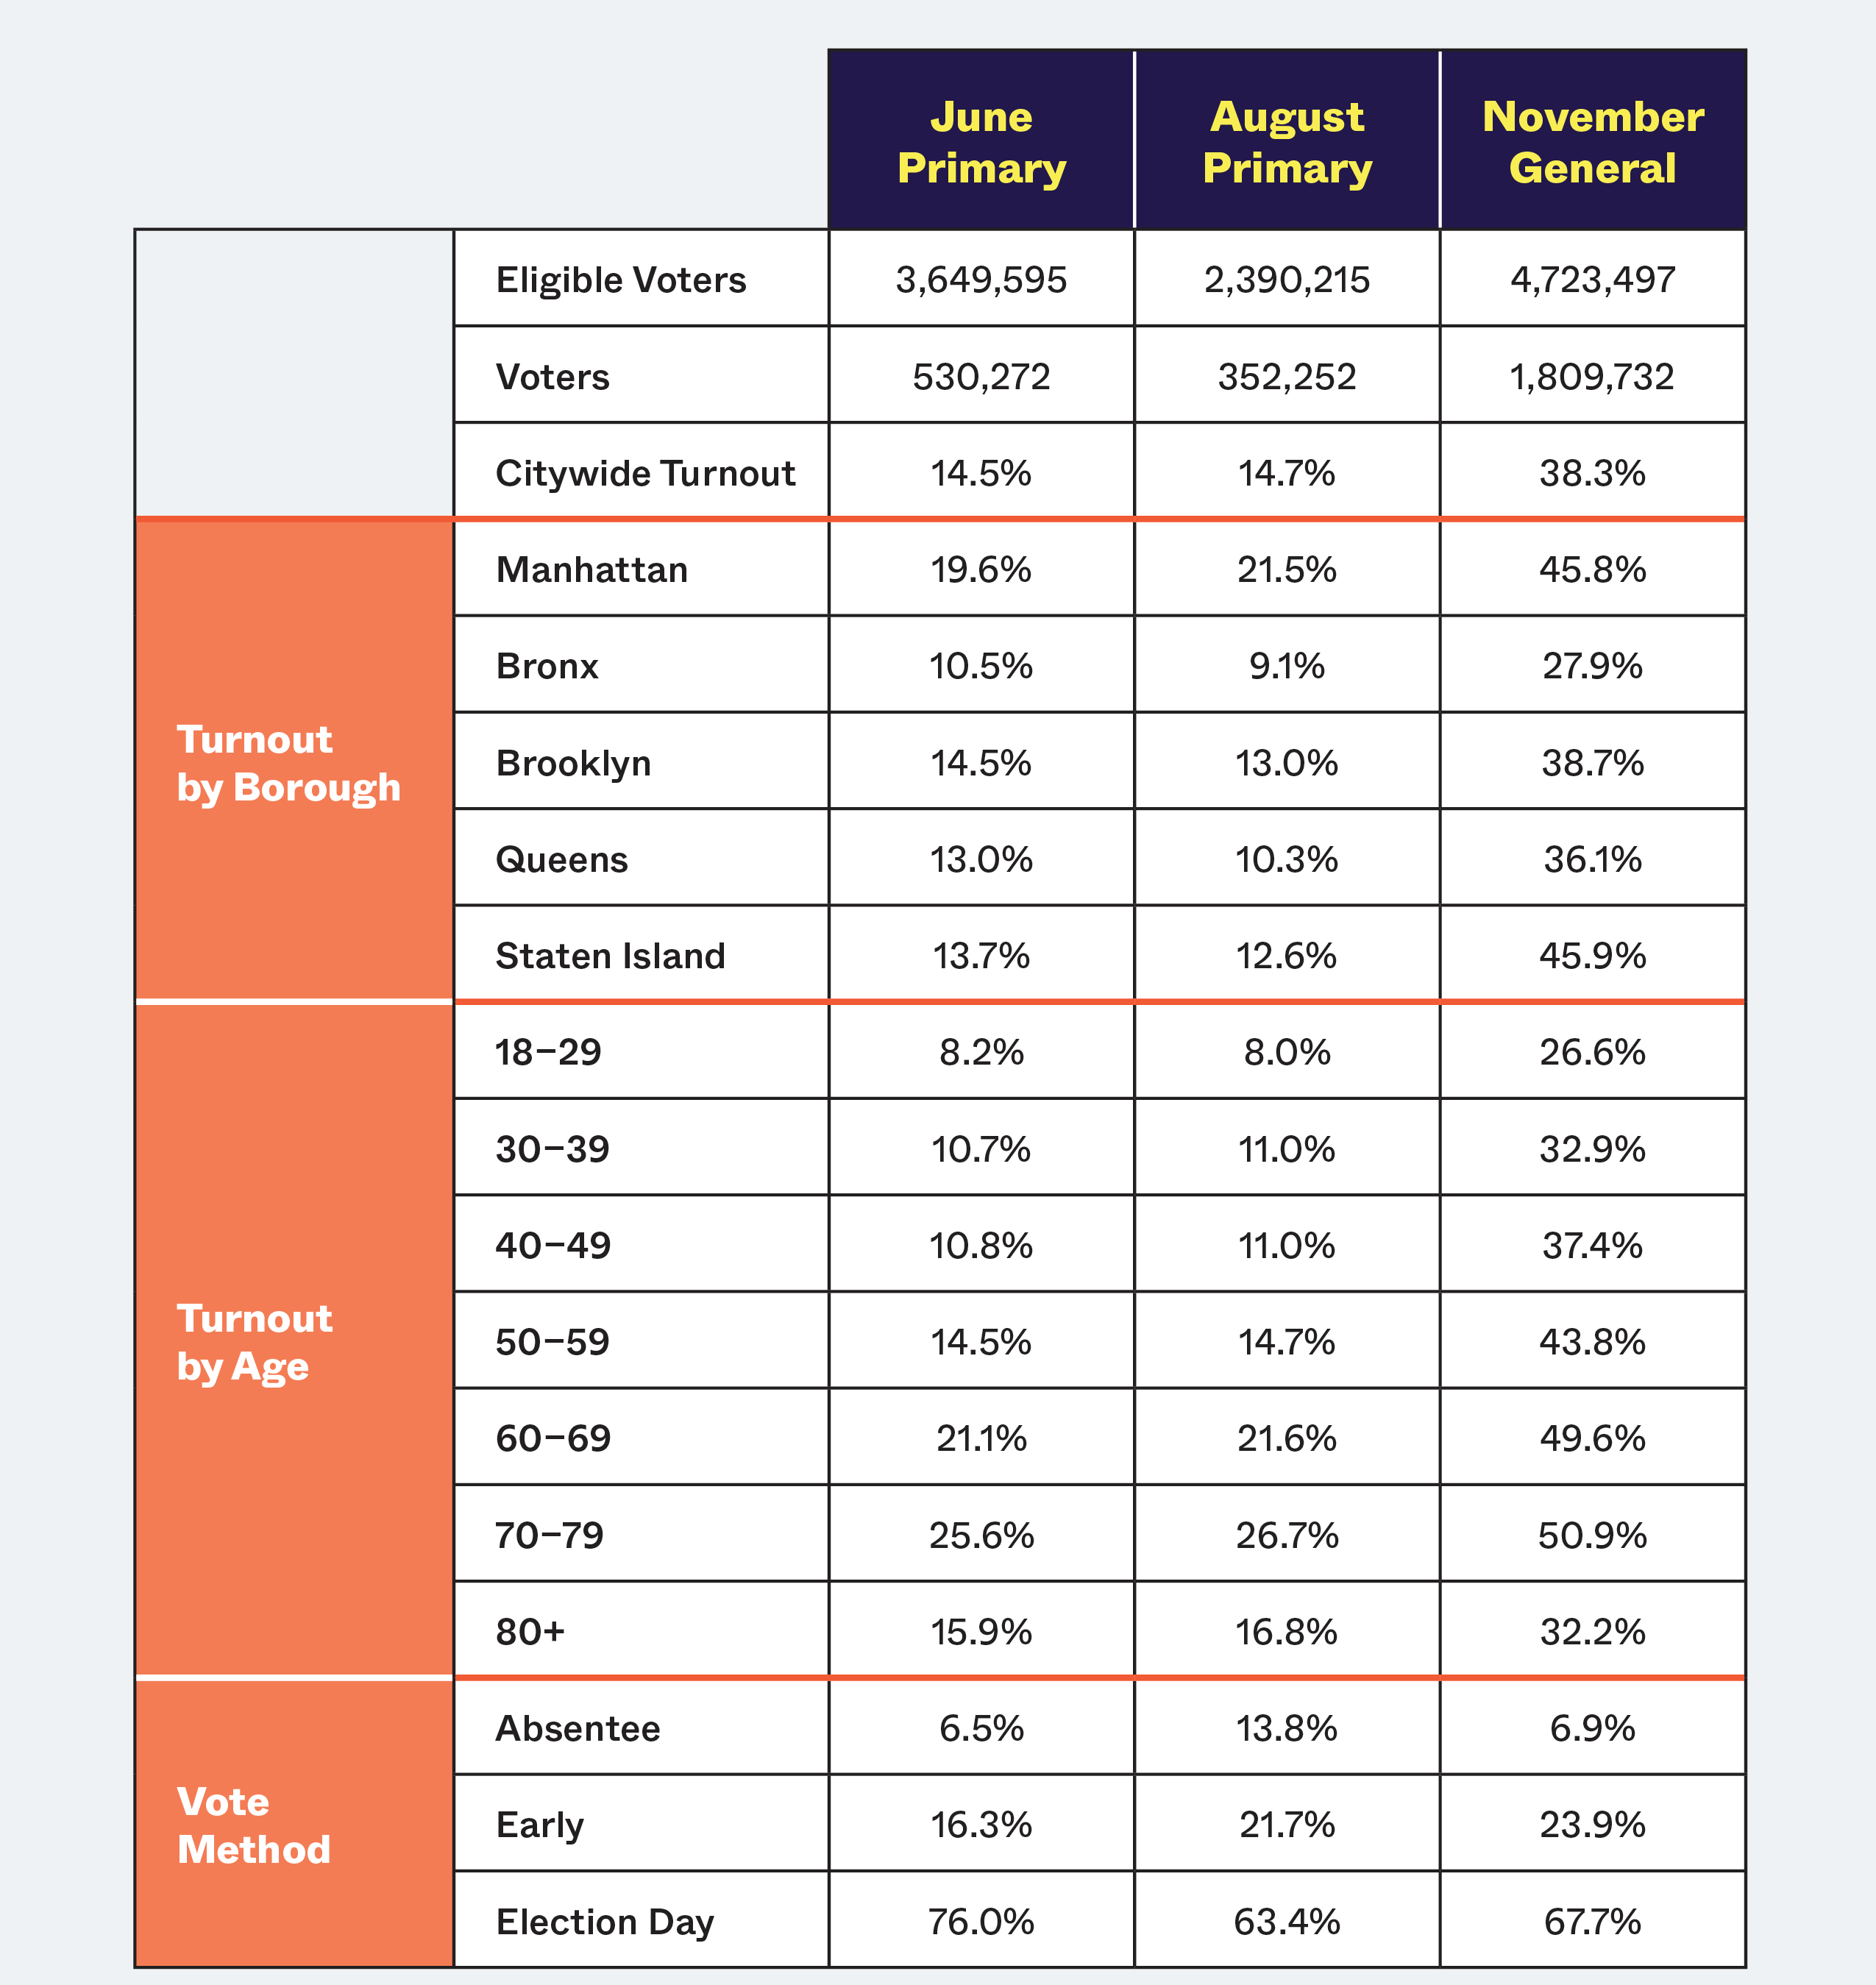
We take a closer look at voter data throughout all city elections over the past year including:
- Registered voter data including those newly registered
- NYC had nearly 5 million registered voters, and a registration rate of 85.9%
- 154k of those were newly registered
- Age distribution of voters in 2022
- The average age of voters in the primaries was 57
- The average age of registered voters is 49
- Borough, and neighborhood specific voting data
- Among both primaries, Manhattan had the highest turnout and the Bronx had the lowest turnout
- Turnout in the 3 citywide elections
- 530,272 voters turned out in June’s primary
- 352,252 voters turned out in the August primary
- 1,809,732 voters turned out in November’s general election
- Voting method in each election
- Most voters chose to vote on Election Day: 63% in the August primary, 76% in the June primary, and 68% in November
- Ballot proposal summaries and voting numbers
- 1.8 million voters overwhelmingly voted to pass all four ballot questions
- Special Election voter turnout by location, borough, and district-wide participation
- Almost 60% of City Council districts, the majority of them in the Bronx and East Brooklyn, had low participation
Turnout Maps
June Primary
August Primary
November General
Special Elections
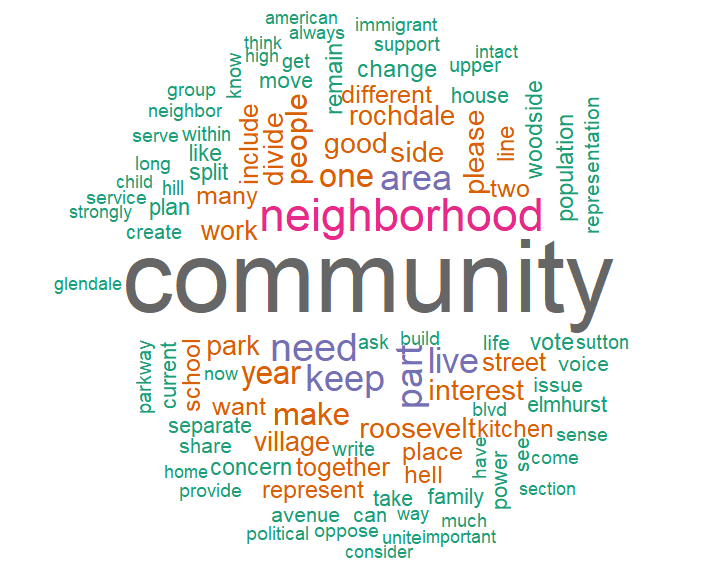 Our redistricting analysis examines public testimony submitted throughout the redistricting process and makes a strong case for public engagement.
- Focuses on commonly used words, the positive or negative tone expressed in testimony, and similarities that appeared in testimony as a result of language shared from community-based groups. These words provided valuable insight into the unique qualities of the neighborhoods they represent.
- In Brooklyn Council District 33, the top words were ‘Williamsburg, ‘orthodox’ and ‘appeal’. Many testifiers self-identified as Orthodox Jewish and raised concerns that the draft maps divided their community, and its shared interests, into two separate districts.
- Highlights concerns about community division shared by residents in neighborhoods including Hell's Kitchen, Glendale, and Soho.
- Testimony on Manhattan Council Districts 3, 4, and 6 expressed concerns about the initial draft maps that divided Hell's Kitchen among these three districts.
- Provides evidence that testimony had an impact on the final district maps drawn.
- Residents in Queens Council Districts 19 and 23 worried that AAPI (Asian American Pacific Islander) representation in the initial draft maps would split the Bayside Hills community into separate districts. In the final plan, Bayside Hills remained entirely in Queens Council District 23.
NYC Districting Commission's Drafts of District Lines
Redistricting Testimony Statistics
The Campaign Finance Board is eager to work with local organizations, government officials, City agencies and voters to support accessible voting reforms. This year’s policy and legislative recommendations address low turnout rates, the legacy of disenfranchising legislation, and the ways that language barriers impact the voting process.
The Campaign Finance Board is eager to work with local organizations, government officials, City agencies and voters to support accessible voting reforms. This year’s policy and legislative recommendations address low turnout rates, the legacy of disenfranchising legislation, and the ways that language barriers impact the voting process.
Align Elections with Even-Year Races
Recommendation 1 proposes changing the timing of local elections to align with even-year races for president or governor, helping to boost interest and turnout.
Average turnout for NYC elections (2001-present) by election type
| Mayoral Elections | Gubernatorial Elections | Presidential Elections |
|---|---|---|
| 29.5% | 35.6% | 60.8% |
Increase Accessibility of Ballot Proposal Language
Recommendation 2 suggests that ballot proposals be written in “plain language” to make it easier for voters to understand.